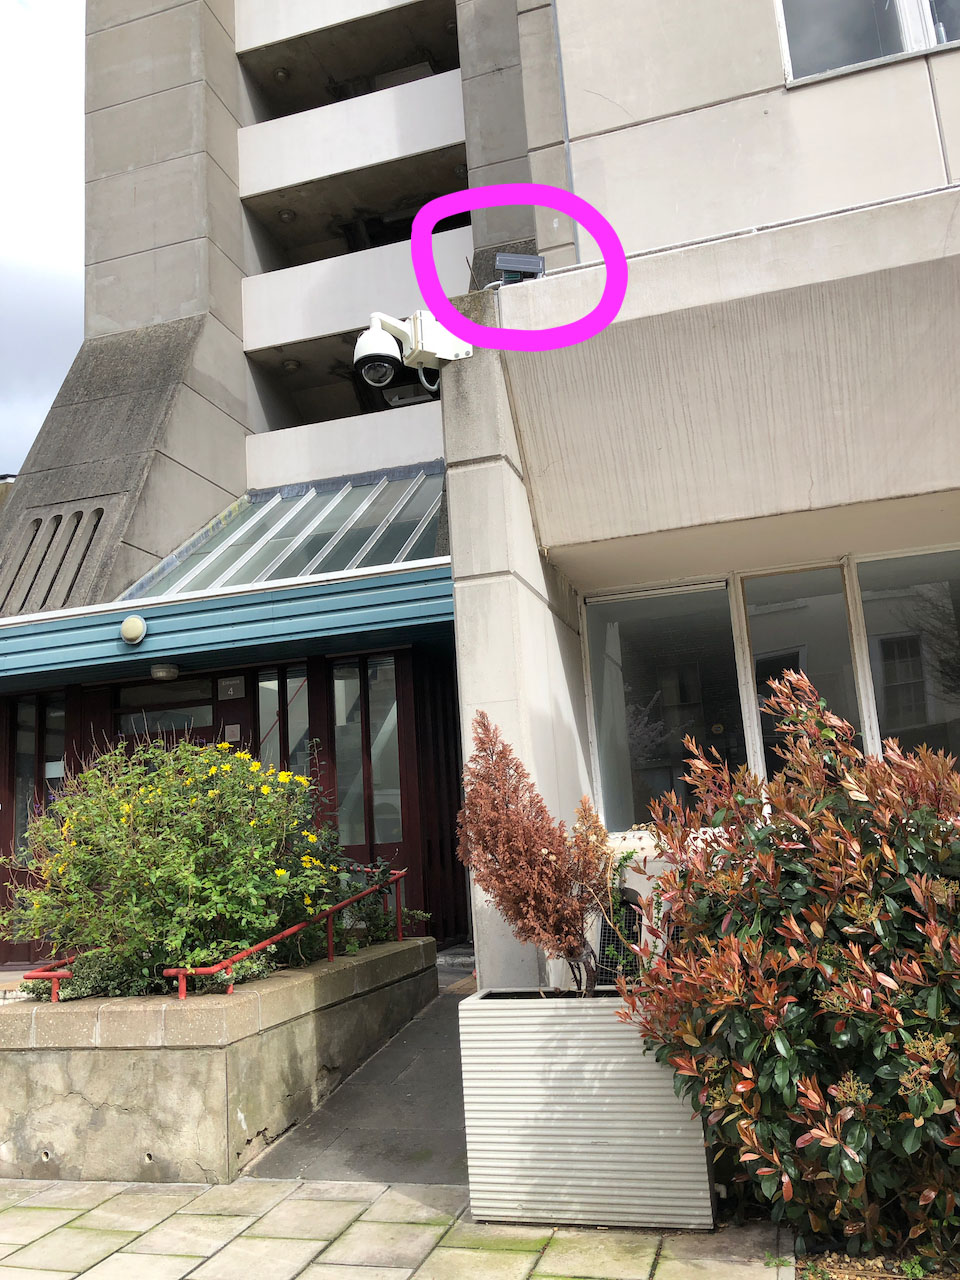
Brunswick TRA successfully bid to get a BREATHE LONDON sensor:
we’ve got lots of green trees and small parks nearby and wanted to know if that was enough to protect us from air pollution.
Here’s our sensor results from March 2022 til August 2023:
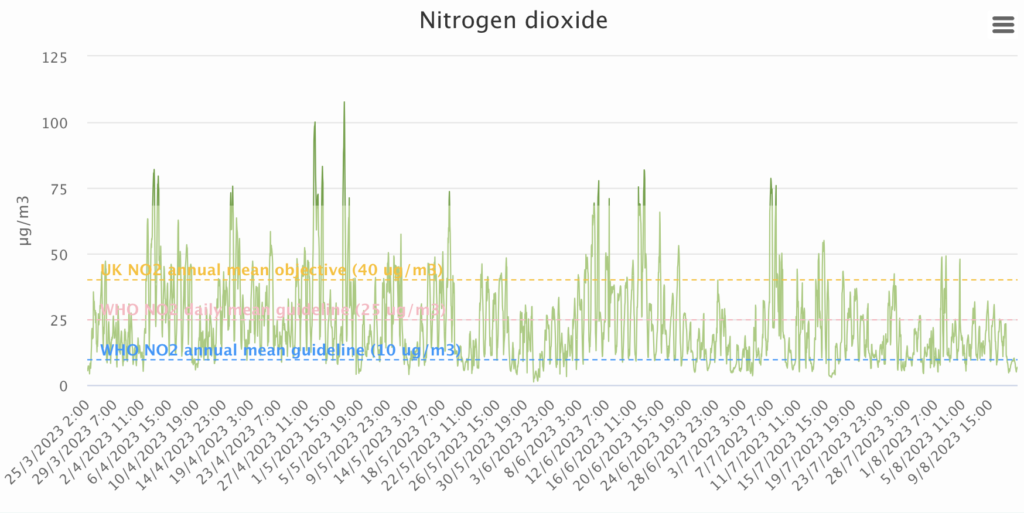
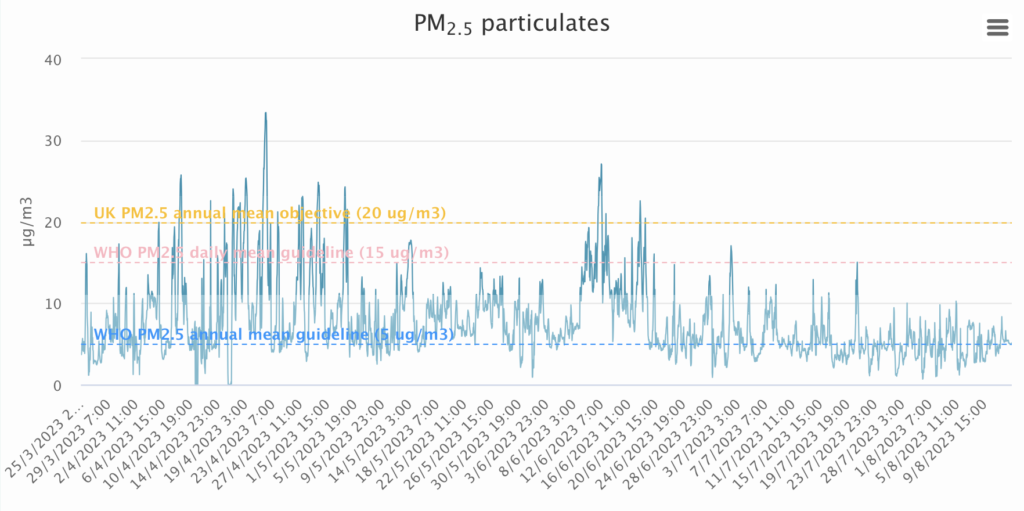
These graphs show we’re missing the UK objectives, WHO daily and annual means for No2 and PM2.5
There’s such a lot of variation – day to day, and month to month – that I quickly decided ‘averages’ weren’t likely to be that helpful.
But it is clear that we’re NOWHERE near WHO levels.
And also clear that the UK guideline levels are LOTS less challenging, LESS SAFE than international levels.
So the answer for the Brunswick TRA is … NO, our green is NOT keeping us safe.
Though who knows how much worse it would be without the trees!
Are we UK residents less worthy of a safe environment than people living in the rest of the world?
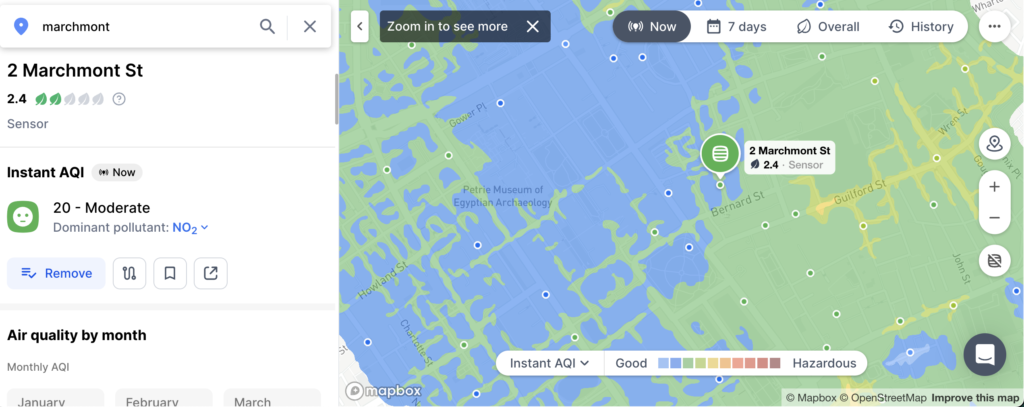
There are other local sensor systems.
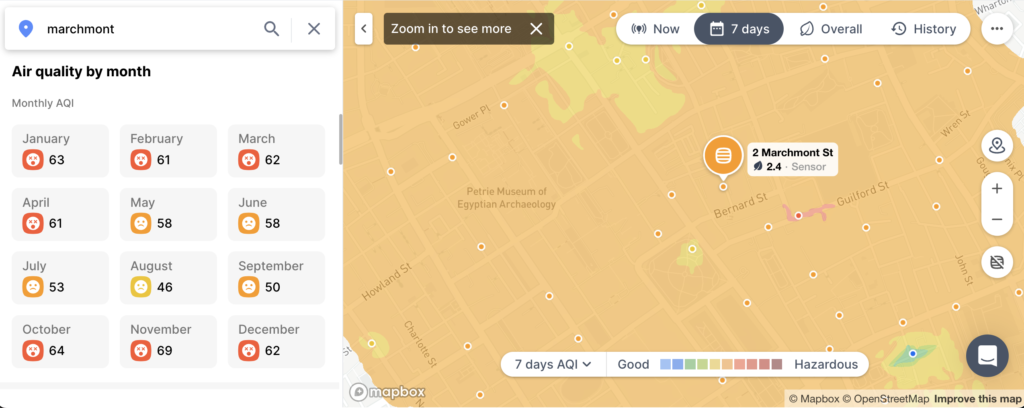
The first I discovered was AIRSCAPE.AI : with over 200 monitors across Camden, and an artificial intelligence system joining up results geographically.
Here’s the results ‘now’: 20.00 on Sunday in August. We look OK:
But it gets worse if we look at the results for the last 7 days.
The results seem better in the summers – this is data from the last 2 years:
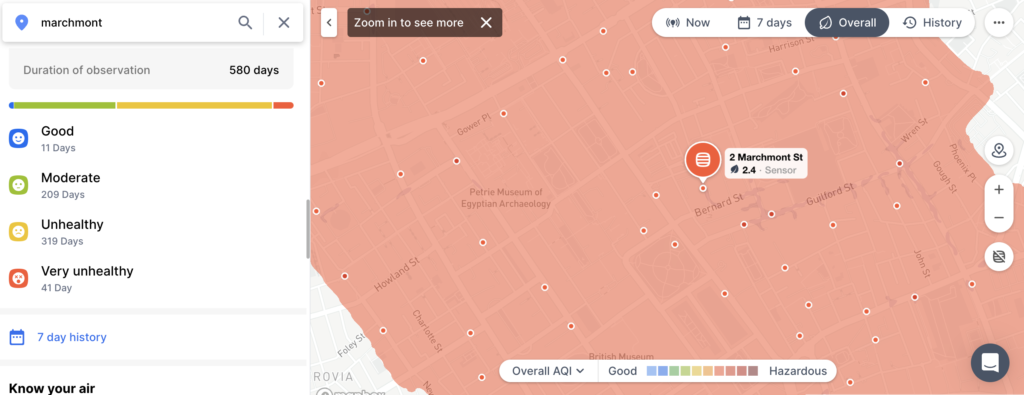
Its even worse looking over a longer time period.
There’s only 11 days in 2 years which had ‘good’ air quality.
I’m not surprised that, when I first spoke to them, Airscape staff told me that the Brunswick centre, where I live, was ok to visit, but not to spend a day at.
I pointed out that hundreds of people – including me – live and work here.
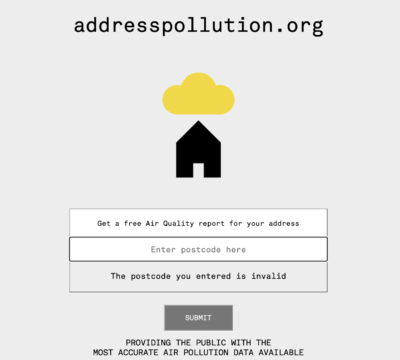
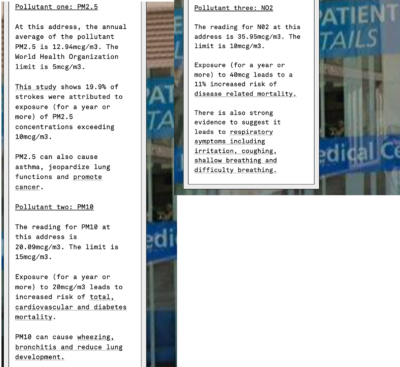
Then there’s ADDRESSPOLLUTION.ORG
Just write your postcode in and get a summary:
My postcode results were terrifying:
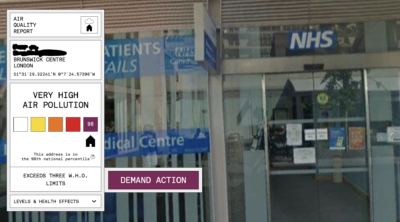
And heres the shocking details for levels and health effects:
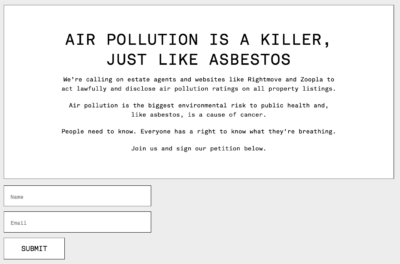
This is what happens if you ‘demand action’:
RIGHT TO KNOW use different data – and get ‘less bad’ results.
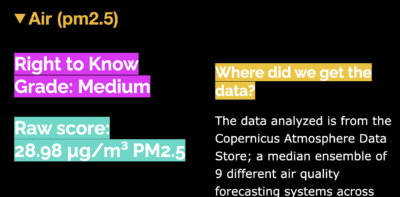
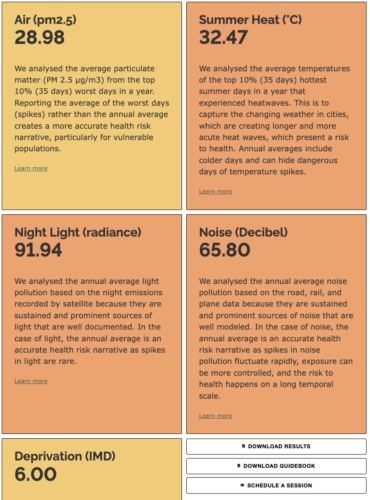
Right to know average out results from the top 10% worst results – which “creates a more accurate health risk narrative, particularly for vulnerable populations”.
They also consider different sorts of pollution: air, summer heat, night light, noise plus deprivation levels.
Just in case you wanted any more pollution monitoring systems theres AIRLY
In one of their great blogs – they are concerned that “air quality data can be displayed in a number of different formats which could be confusing or even misleading”.
I think this is unrealistic – especially for the more deprived communities that are at most risk from air pollution.
And since the advice in high pollution times is for vulnerable people not to go outside, I’m also concerned about suggesting that we need to go out to see how bad the problem is?
In Sept 2021: “the annual guideline level for fine particulate matter (PM2.5) – the air pollutant most harmful to human health – was lowered from 10 µg/m3 to 5 µg/m3 and the guideline level for nitrogen dioxide was reduced from 40 µg/m3 to 10 µg/m3.”
DEFRA said “We will consider the updated WHO guidelines on PM2.5 to inform the development of air quality targets but we must not underestimate the challenges these would bring particularly in large cities and for people’s daily lives.”
I dont understand this. I’d have thought that the challenge of deaths, early deaths and illness should not be underestimated.
But apparently that’s not considered important.